Livingston Trace Subdivision Denham Springs Home Sales Update 2013
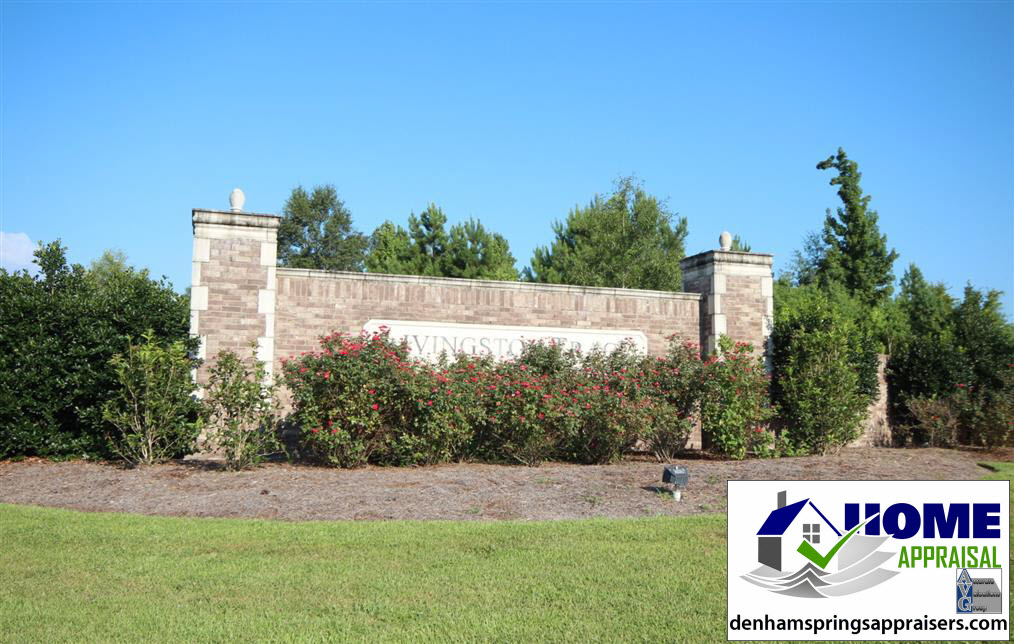
Livingston Trace Subdivision Denham Springs Home Sales Update 2013 In my opinion, in comparison to similar subdivisions like South Point, Woodland Crossing and Westminister Estates, Livingston Trace is one of the better performing subdivisions of this home quality.  Median Sales Prices are $145,000 for Livingston Trace, only $132,653, $145,000 for Woodland Crossing and $150,000 for Westminister Estates. Denham Springs Neighborhood Description: Denham Springs population 10,375, 19% growth since 2000. Since mid 1990’s, rapid residential and commercial development. Draw to Western Livingston is well performing public schools and lower priced housing. Livingston is one of fastest growing Parishes in Louisiana. Location is Continue reading Livingston Trace Subdivision Denham Springs Home Sales Update 2013

Home Appraisers Denham Springs 2011 Housing Report

https://www.denhamspringsappraisers.com/ – Home Appraisers Denham Springs 2011 Housing Report Summerfield Subdivision Denham Springs 2011 Housing Numbers. It used to be that homes in Summerfield sold in the $110/sf to $112/sf range. That was then and this is a new housing market in 2011. Here are the Summerfield Subdivision housing numbers from end of December 2010 to end of December 2011. Average sales price was down from $192,380 in 2010 to $174,150 in 2011 or -9.5%. Median sales price was was down from $189,500 in 2010 to $175,000 in 2011 or -7.7%. However, the average sold price per sq. ft. was Continue reading Home Appraisers Denham Springs 2011 Housing Report

Denham Springs Home Appraisers: Westminister Estates 2011 Update

https://www.denhamspringsappraisers.com/ – Denham Springs Westminister Estates 2011 Housing Report. Average sold price declines 6.4% and average sold price per sq. ft. declines $10.43/sf. The Legal Name of this development at the Livingston Parish Courthouse and in filing records is Westminister Estates, meaning the sign is wrong. Here are the Westminister Estates housing numbers from end of December 2010 to end of December 2011. Average sales price was down from $149,880 in 2010 to $140,293 in 2011 or -6.4%. Median sales price was basically unchanged. However, the average sold price per sq. ft. had a -$10.43/sf decline from $91.52 in 2010 Continue reading Denham Springs Home Appraisers: Westminister Estates 2011 Update

Denham Springs Homes Appraisers: Area Foreclosures Are A Concern

Foreclosures In Denham Springs Watson Walker Are Somewhat Of A Concern Since Western Livingston Parish Is Primarily A Lower Priced Housing Market, See Chart Below! Western Livingston Parish has experienced a high “272” foreclosures with the most by far occuring in the $100K to $149K range, which is some reason for concern as the predominant price range of home sales are in the $140,000 to $170,000 range. This is a series of Five (5) total articles with accompanying videos posted to “Foreclosure Studies” category. Article One covered entire Greater Baton Rouge Foreclosure Housing Market Trends. Article Two covered East Baton Continue reading Denham Springs Homes Appraisers: Area Foreclosures Are A Concern

Denham Springs Home Appraisers: Summerfied Sudivision 2010 Price Trends Report!

https://www.denhamspringsappraisers.com/ – Denham Springs Home Appraisers: Summerfield Sudivision 2010 Price Trends Report! NOTE: If you are considering purchasing a home in Summerfield Subdivision and don’t want to pay too much, I would advise one to order a “Pre-Purchase Appraisal” from Accurate Valuations Group as there is a gradual and steady decline of home prices in Summerfield since 2007 meaning one shouldn’t overpay for a home in Summerfield. REO or Foreclosure and Short Sales activity is increasing in Summerfield in 2010 and into 2011 as this appraiser just this week appraised a foreclosure on Summerfield Drive. And, there is one (1) Continue reading Denham Springs Home Appraisers: Summerfied Sudivision 2010 Price Trends Report!

2010 Greater Baton Rouge Short Sales Study Released, 2 Percent Of All Sales

http://www.batonrougerealestatetrends.net/ – 2010 Greater Baton Rouge Short Sales Study Released, Approximately 2 Percent Of All Sales! Greater Baton Rouge Appraiser, Bill Cobb, has performed a study on the number of “short sales” taking place within the Greater Baton Rouge Housing Market. This was a rather difficult study to complete because of the lack of designation of short sales within the local GBRMLS. In other words, there’s no box for agents to check that specifically states the reason for the sale was “Short Sale”. So, this makes the numbers below somewhat questionable because of the lack of a proper method for Continue reading 2010 Greater Baton Rouge Short Sales Study Released, 2 Percent Of All Sales

2010 Comprehensive Greater Baton Rouge Foreclosure Numbers And Charts Released

http://www.batonrougerealestatetrends.net/ – 2010 Comprehensive Greater Baton Rouge Foreclosure Numbers and Charts Released   East Baton Rouge Foreclosure Trends: East Baton Rouge 2009 2010 Foreclosure Sales Numbers! 2010 Foreclosures total 12% of sales YTD; 2009 Foreclosures totaled 11%. 7% of all EBR MLS Listings are Foreclosures! Foreclosures are negatively impacting this market. Where Are The 2010 East Baton Rouge Foreclosures Concentrated? AREA 11 FORECLOSURES, Primarily Baker. In Area 11 in 2010, there have been 33 solds in Baker and 13 in Zachary. In 2009 and 2010, the Baker market has experienced a significant amount of fore closure activity as it was Continue reading 2010 Comprehensive Greater Baton Rouge Foreclosure Numbers And Charts Released

Where Are The 2010 Livingston Parish Foreclosures Taking Place?

Where Are The 2010 Livingston Parish Foreclosures Taking Place? Livingston Parish Fore closure Trends: 2009 2010 Foreclosure Sales Numbers! 2010 Foreclosures total 13% of sales YTD; 2009 Foreclosures totaled 9%, an increase of +2% since 2009. 7% of all Livingston MLS Listings are Foreclosures! Foreclosures are negatively impacting this market. Where Are The Foreclosures Most Concentrated? The chart below represents the number of recorded Livingston Parish REO or Foreclosure Sales within the Greater Baton Rouge MLS (Multiple Listing Service), with the exception of Manufactured Housing sales. Greater Baton Rouge MLS Areas for Livingston Parish are 80, 81, 82 and 83. Continue reading Where Are The 2010 Livingston Parish Foreclosures Taking Place?

Livingston Parish Foreclosure Trends: 2009 2010 Foreclosure Sales Numbers!

https://www.denhamspringsappraisers.com/ – Livingston Parish Fore closure Trends: 2009 2010 Foreclosure Sales Numbers! 2010 Foreclosures total 13% of sales YTD; 2009 Foreclosures totaled 9%, an increase of +2% since 2009. 7% of all Livingston MLS Listings are Foreclosures! Foreclosures are negatively impacting this market. There’s A Major “Caveat” with the numbers below! The chart below represents the number of recorded Livingston Parish REO or Foreclosure Sales within the Greater Baton Rouge MLS, with the exception of Manufactured Housing sales. GBRMLS Areas for Livingston Parish are 80, 81, 82 and 83. Let’s put these foreclosure numbers into perspective! In 2009, there were Continue reading Livingston Parish Foreclosure Trends: 2009 2010 Foreclosure Sales Numbers!