Livingston Parish 2016 Home Sales Stats By Subdivision Name
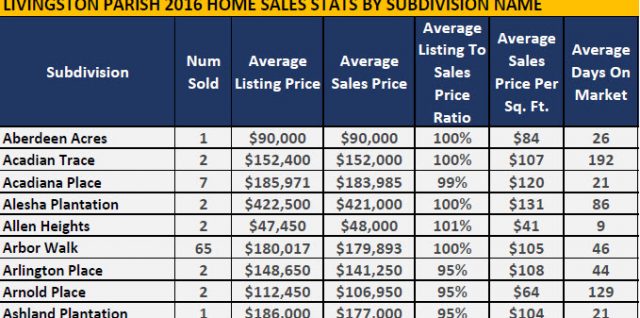
Livingston Parish 2016 Home Sales Stats By Subdivision Name, A Suburb of Baton Rouge. Study includes all residential sales for all types of single family properies in 2016. Study by Bill Cobb Appraiser 225-293-1500 and http://www.denhamspringsappraisers.com Overall in 2016, Livingston Parish real estate experienced a good year with lower inventory forcing increasing prices…until the Great Flood, see chart below. In November 2015, the median sales price was $163,000 which peaked in August at $184,000 only the slide down to $155,000 in November 2016. I believe this correction in home prices could last longer than surrounding Parishes because Livingston was so Continue reading Livingston Parish 2016 Home Sales Stats By Subdivision Name

Carter Hills Denham Springs Home Sales Update 2015-2016

Carter Hills subdivision in Denham Springs home sales trends are listed below as a result of research for a 2016 home appraisal. May 2015 to June 2016 Home Sales Trends Nine Sales from $147,000 to $194,000 Median Sales Price $168,000 Median Sold Price Per Sq. Ft.:$121/sf Average Sold Price: $169,888 Average Sold Price Per Sq. Ft.:$119/sf Homes Sold From $106/sf to $127/sf Average SP/LP% 98% Average Days On Market: 53 Days Average Home Is 3 Bedrooms, 2 Baths, 1,431sf The “Average SP/LP% 98%” or Listing To Sales Price Ratio means the average home sold for 2% less than listing price. Continue reading Carter Hills Denham Springs Home Sales Update 2015-2016

Denham Springs Home Appraiser: What Are Most Popular Selling Livingston Parish Subdivisions?

Denham Springs Home Appraiser: What Are Most Popular Selling Livingston Parish Subdivisions? The chart below shows those subdivisions with the most home sales since January 1, 2011.  The subject with the most home sales was not a subdivision at all but rural acreage tract, 260 sales.   Chart includes at least 5 sales and filters down to most home sales. SUBDIVISION Avg Sold $ Med Sold $ Avg $/Sqft Avg SP/OLP Avg DOM # Listings COUNTRY CROSSING $268,217 $252,000 $105 95 204 5 DRIFTWOOD ESTATES $138,000 $132,500 $94 93 133 5 EAGLE RIDGE ESTATES $126,540 $123,950 $81 93 84 5 ESTELLE Continue reading Denham Springs Home Appraiser: What Are Most Popular Selling Livingston Parish Subdivisions?

2010 Comprehensive Greater Baton Rouge Foreclosure Numbers And Charts Released

http://www.batonrougerealestatetrends.net/ – 2010 Comprehensive Greater Baton Rouge Foreclosure Numbers and Charts Released   East Baton Rouge Foreclosure Trends: East Baton Rouge 2009 2010 Foreclosure Sales Numbers! 2010 Foreclosures total 12% of sales YTD; 2009 Foreclosures totaled 11%. 7% of all EBR MLS Listings are Foreclosures! Foreclosures are negatively impacting this market. Where Are The 2010 East Baton Rouge Foreclosures Concentrated? AREA 11 FORECLOSURES, Primarily Baker. In Area 11 in 2010, there have been 33 solds in Baker and 13 in Zachary. In 2009 and 2010, the Baker market has experienced a significant amount of fore closure activity as it was Continue reading 2010 Comprehensive Greater Baton Rouge Foreclosure Numbers And Charts Released

Where Are The 2010 Livingston Parish Foreclosures Taking Place?

Where Are The 2010 Livingston Parish Foreclosures Taking Place? Livingston Parish Fore closure Trends: 2009 2010 Foreclosure Sales Numbers! 2010 Foreclosures total 13% of sales YTD; 2009 Foreclosures totaled 9%, an increase of +2% since 2009. 7% of all Livingston MLS Listings are Foreclosures! Foreclosures are negatively impacting this market. Where Are The Foreclosures Most Concentrated? The chart below represents the number of recorded Livingston Parish REO or Foreclosure Sales within the Greater Baton Rouge MLS (Multiple Listing Service), with the exception of Manufactured Housing sales. Greater Baton Rouge MLS Areas for Livingston Parish are 80, 81, 82 and 83. Continue reading Where Are The 2010 Livingston Parish Foreclosures Taking Place?