Plantation Estates Subdivision Denham Springs Post Flood Home Sales Update as of May 29 2017
Are buyers willing to purchase flood-renovated homes in Plantation Estates closer to Interstate 12 and the Amite River? According to GBRMLS, homes on Hermitage Dr experienced 4.5 feet of flood water.
See my commentary in the Number of Post Flood Renovated Listings: 2 section.
There’s only two GBRMLS listings, period.
 Other Western Livingston Parish flood updates can be found here: https://www.denhamspringsappraisers.com/category/flood-study/
As far as I know, ALL homes in Plantation Estates flooded during the “Great Flood” of August 12-15, 2016. I use the term “ALL” loosely and I can’t be 100 percent sure. My drive-through the subdivision did appear to show all or most did flood. It appears the vast majority of homeowners within have chosen to remain, repair and not sell, which is a huge positive for the subdivision and Denham Springs.
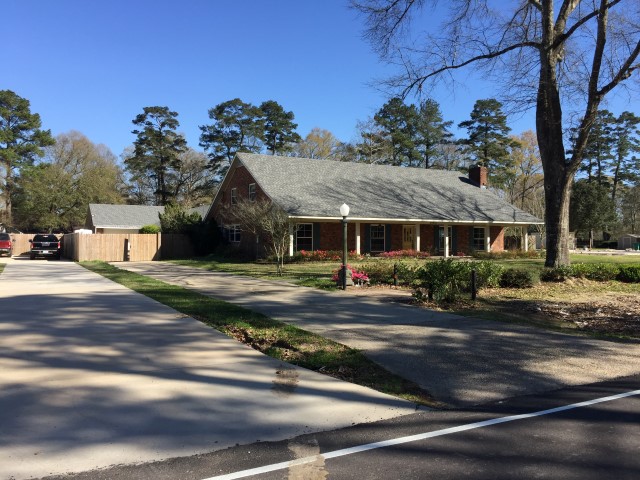
Below is the famous annual Messengers Christmas Land House we’d drive to to see 2 lots of Christmas attractions. It did flood and with 4843 sq. ft., it only sold for only $205,000 or $42 per square foot. I appraised this home prior to the owner selling a couple of years ago.
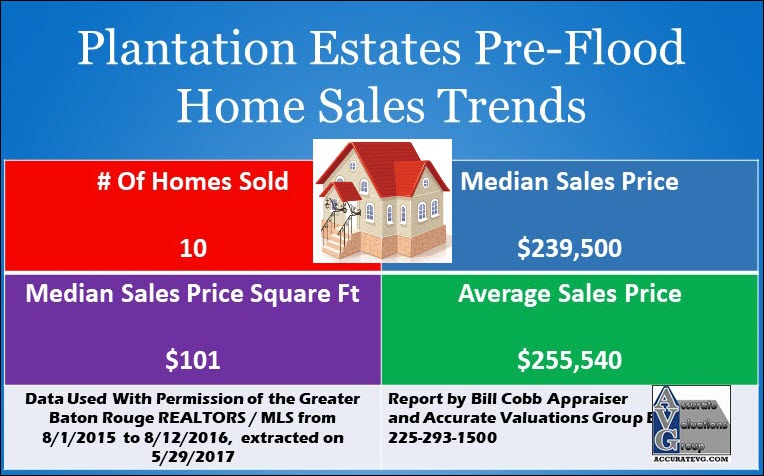
PLANTATION ESTATES PRE-FLOOD SALES TRENDS
From 8/1/2015 to 8/12/2016 prior to the flood, there were 10 GBRMLS sales from $220,000 to $370,000 selling on average for $101 per square foot with a median sales price of $239,500. The average sold price was $255,540 selling on average in 36 days and for 97 percent of listing prices.
PLANTATION ESTATES POST-FLOOD HOME SALES TRENDS
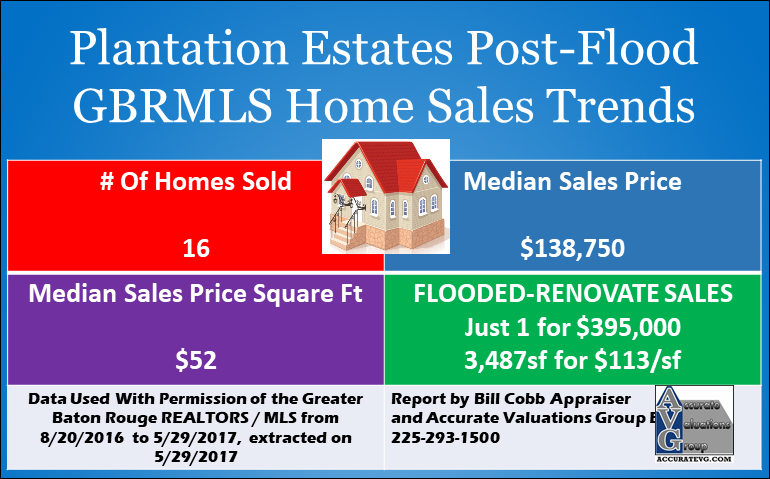
Total Number of Post Flood Sales: 16
Since the flood, there’s been 16 total GBRMLS home sales within Plantation Estates. There appears to have been 15 flood damaged home sales from $90,000 to $205,000. On average, these sold for $52 per square foot and $138,750.
Number of Post Flood Renovated Sales: ONLY 1 so far
The 1 sale was of 8310 Hermitage Dr for $395,000 or $113.28 per sq. ft. This home has 3487 sq. ft. on 0.84 acre with gunite swimming pool and many outside extras including outdoor kitchen.
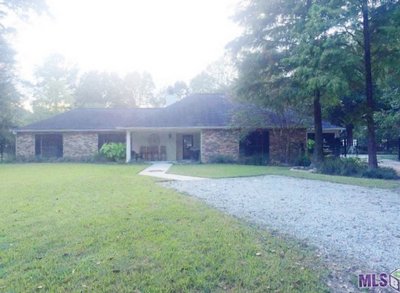
Are Some Buyers Hesistant To Buy Flood-Renovated Homes In Plantation Estates, this close to the Amite River and in a higher price range?
Number of Post Flood Renovated Listings: 2
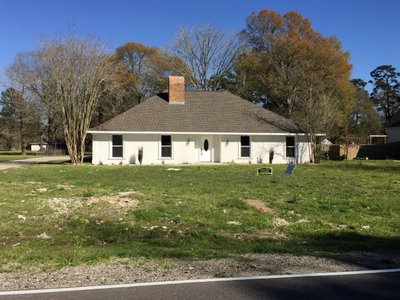
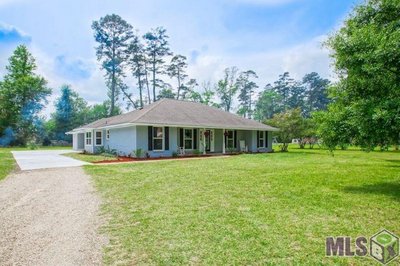
There’s 2 under contract listings offered from $237,900 to $269,000, on aveage for $124 per square foot and $253,450. One of these homes is only 1,776 sq. ft. on 1 acre and swimming pool for $237,900 or $134 per sq. ft., a price unheard of pre-flood. This home was on the market for 41 days. Perhaps low inventory in Greater Baton Rouge is influencing this buyer to buy at this price. The other listing I measured for the Agent, 2379 sq. ft. on 1 acre for $269,000 or $113 per sq. ft. Despite a spectacular renovation, this listing proved to me, after it being on the market for a long 176 days on the market in two listings, showed me some buyers hesitancy to buy a flood renovated home in Plantation Estates. People and potential buyers have long memories. These are only listing prices, not closed sales.
IF INVENTORY WASN’T SO ULTRA LOW WITHIN GREATER BATON ROUGE, I DON’T BELIEVE BUYERS WOULD BE PAYING THESE HIGH PRICES INSIDE PLANTATION ESTATES.
From my research and experience with TWO pre-listing appraisals of higher priced flood-renovated homes near I-12, the higher educated the buyer and a price over $200,000 increases marketing time and buyer resistance to buying a flood-renovated home. One exception was 7870 Denham Chase Ave sold for $310,000 or 124/sf with 2496 sq. ft., on the market for 18 days.
Plantation Estates historical sales trends chart is below
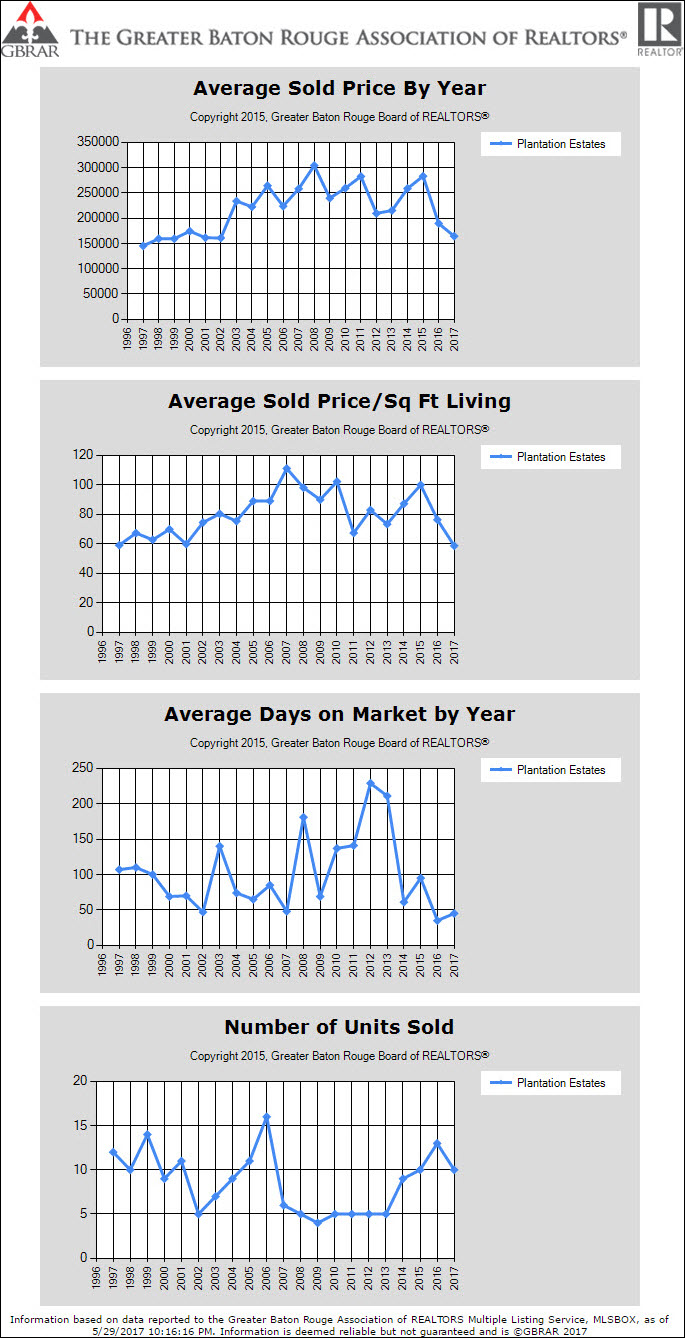
Data Source: Based on information obtained from the Greater Baton Rouge Association of REALTORS / MLS from periods 8/1/2015 to 05/29/2017 and extracted on 05/29/2017.
NOTE: The author of the house in these 2 infographics is “cgvector” from uidownload dot com
