South Point Subdivision Denham Springs Post Flood Home Sales Update as of May 26 2017
South Point is being helped tremendously by the Greater Baton Rouge area’s low inventory of homes for sale. Pre-flood, the larger homes in South Point were selling in the $160s to low $170s and the flooded renovated larger homes are selling in the $180s.
 Other Western Livingston Parish flood updates can be found here: https://www.denhamspringsappraisers.com/category/flood-study/
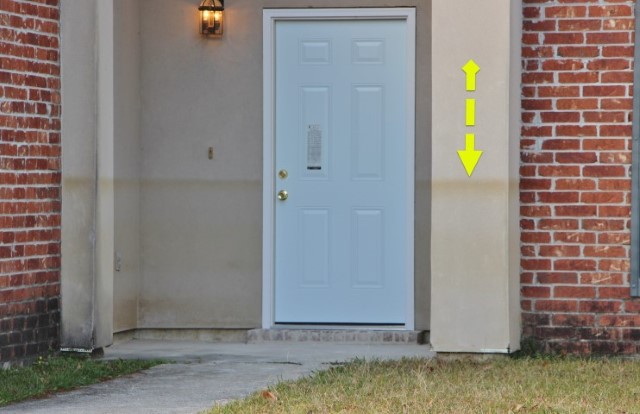
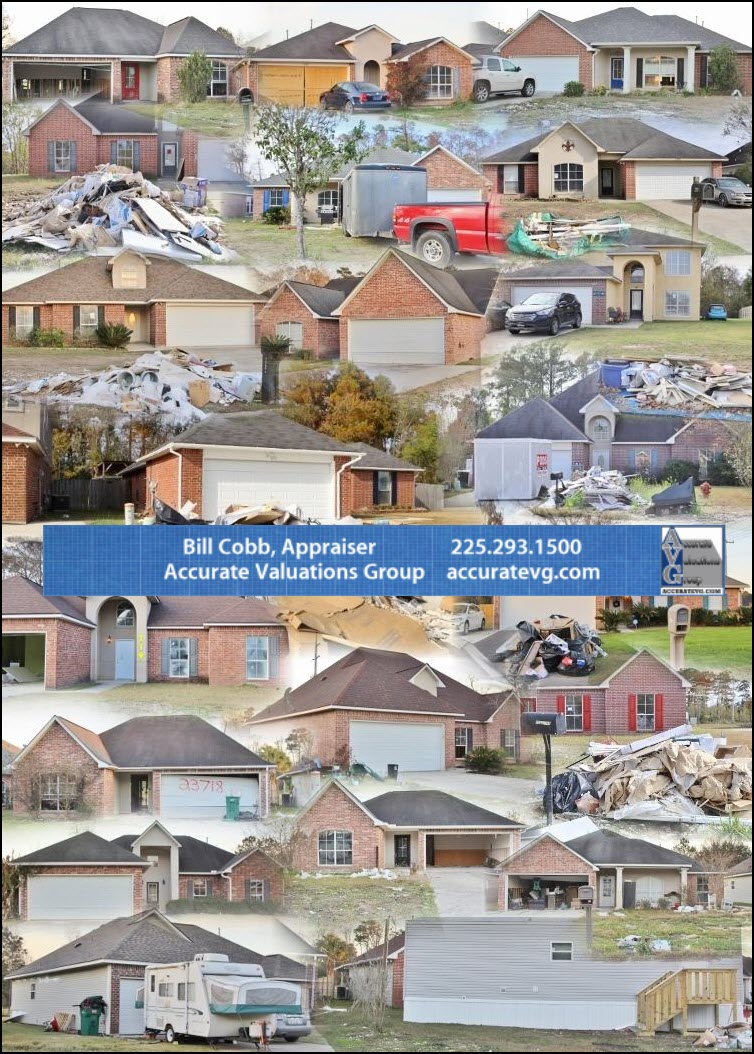
Yes, approximately 35 percent of South Point did flood during the “Great Flood” of August 12-15, 2016, see flood water level in the photo below with yellow arrow pointing to water height. It was the streets closest to Highway 16 that flooded, South Point Dr up to Whitehall Ave, Sweetbriar Ct, Springhill Dr closest to Falcon Crest Dr, Terrace Ave, Sandlewood Dr and Falconcrest Dr.
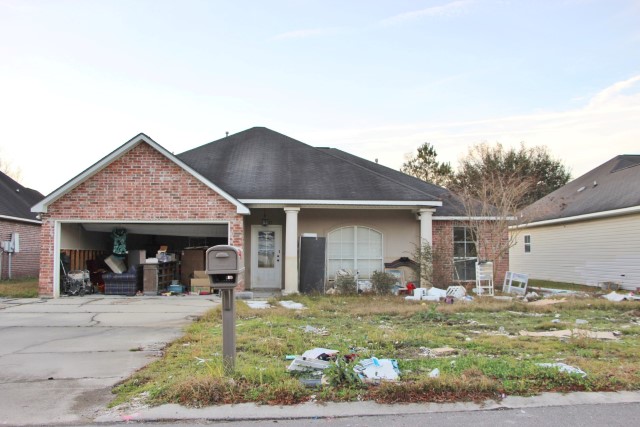
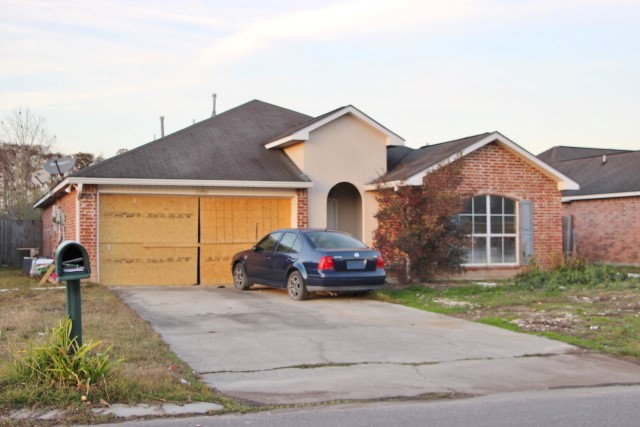
Here’s a collage of South Point flood damaged homes I took after the great flood.
PRE-FLOOD SOUTH POINT HOME VALUES
In 2016 prior to the flood, there were 35 GBRMLS sales from $104,000 to $196,500 selling on average for $92 per square foot with a median sales price of $148,000. The $196,500 sale was for a larger home with inground pool.

POST-FLOOD SOUTH POINT HOME SALES
Total Number of Post Flood Sales: 38
Since the flood, there’s been 38 total GBRMLS home sales within South Point. There appears to have been 9 flood damaged home sales from $60,000 to $96,600. On average, these sold for $44 per square foot and $88,000.
Number of Post Flood Renovated Sales: 6
There’s been 6 sales of flood renovated homes from $155,000, $156,000, $176,000, $178,000, $199,000 and $199,900. On average, these sold for $97 per square foot and $177,000. Pre-flood, homes were generally selling for $92 per square foot and $148,000. So, buyers are paying MORE for these homes post-flood than they did pre-flood.
Number of Post Flood Renovated Listings: 7
There appears to be 3 active listings and 4 under contract listings offered from $153,000 to $199,999, on aveage for $95 per square foot and $184,900.
South Point historical sales trends charts are below
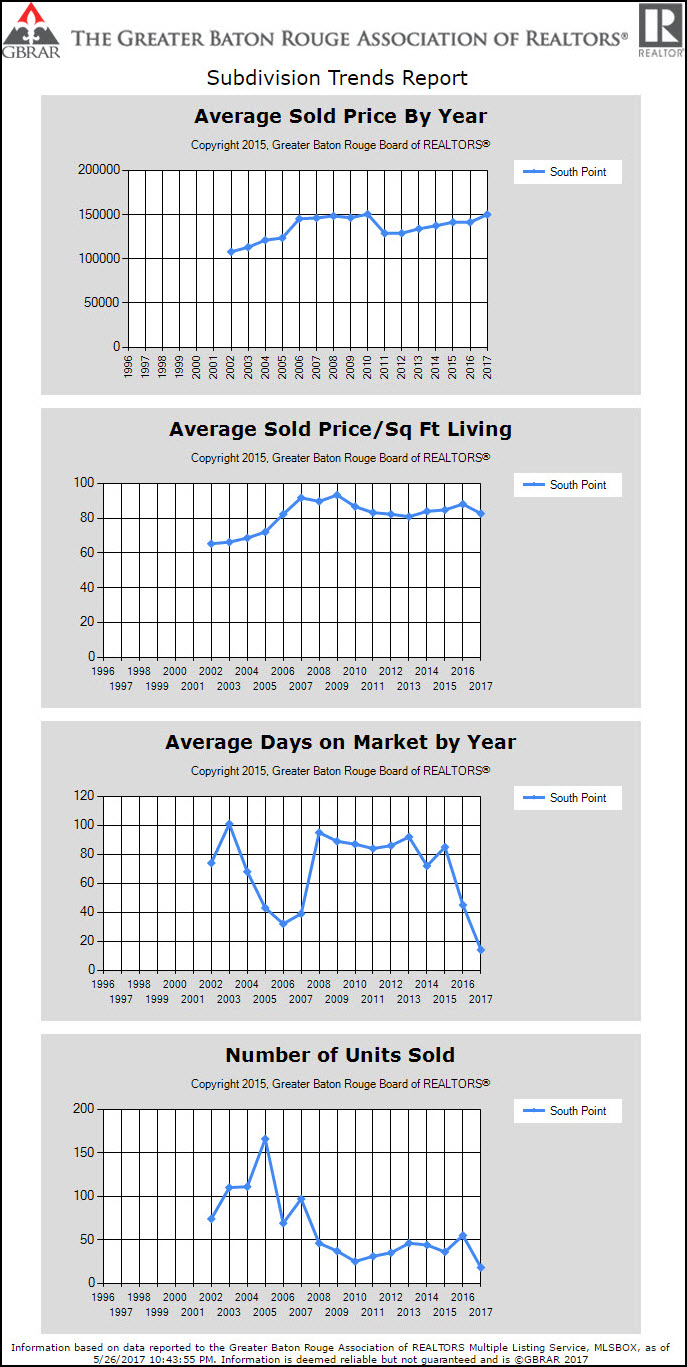
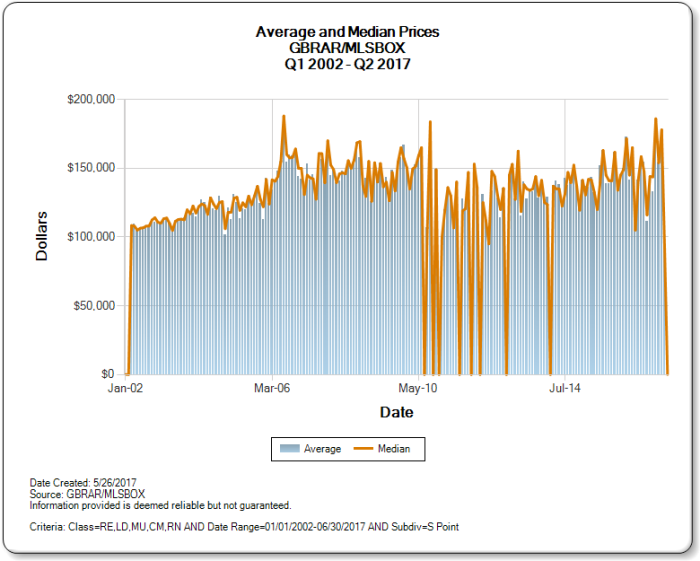
Data Source: Based on information obtained from the Greater Baton Rouge Association of REALTORS / MLS from periods 1/1/2016 to 05/26/2017 and extracted on 05/26/2017.
