Woodland Crossing Subdivision Comprehensive One Year Study Denham Springs. Home Prices Decline
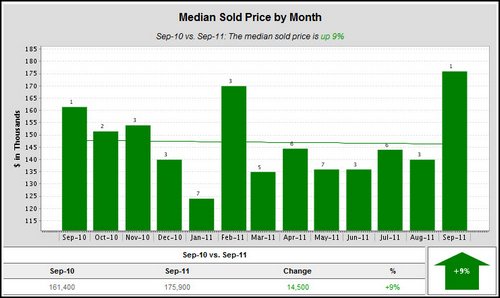
From September 2010 to September 2011, the median sold price is up by 9% (but only based on “1” sale in September 2011 and GBRMLS stats contradict this trend big time).

Recap of 2008 through 2011 YTD Woodland Crossing Housing Numbers:

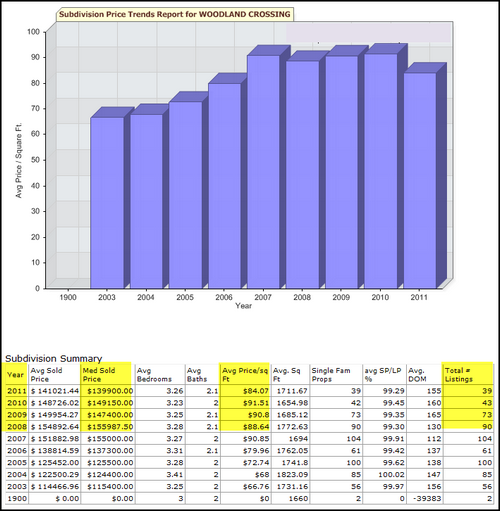
So, from 2008 to 2011, median sales prices have ranged from $156,000, $147,000, $149,000 down to $140,000 in 2011, rounded to nearest 1000. Sold price per sq. ft. continues to decline from $92/sf in 2010 down to only $84/sf in 2011 rounded. 2011 represent 39 sales and only represent three quarters of housing sales numbers, not an entire year.
Solds In Woodland Crossing from 1/1/2011 to 10/12/2011 revealed:
Average Sales Price: $141,803
Average Sold Price Per Sq. Ft.: $80.00
Median Sold Price: $139,900
Number of Sales: 42
Average Days On Market: 109
Low To High: $98,900 to $179,500
Number of Sold REO/Foreclosures Noted In MLS: 7
NOTE: The Median Sales Price Decline from 2010 to 2011 is -6.2%.
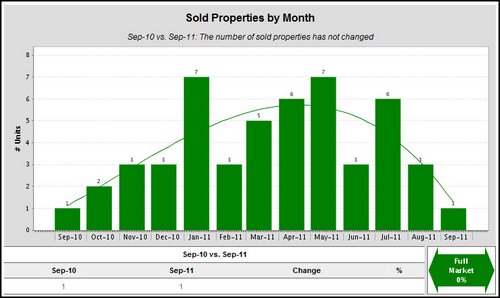
From September 2010 to September 2011, the number of sold properties has not changed.
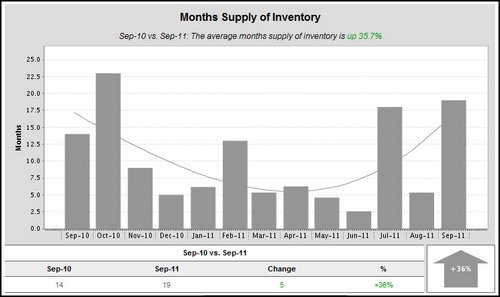
From September 2010 to September 2011, the average months supply of inventory is up 36%.

From September 2010 to September 2011, the number of for sale properties is down 53% and the number of sold properties has not changed.
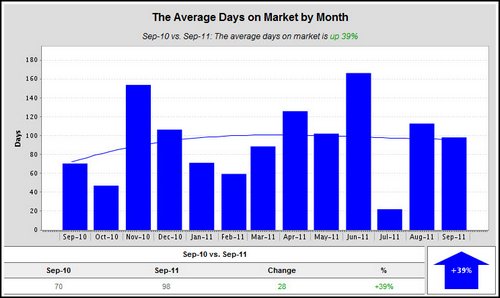
From September 2010 to September 2011, the Average Days On Market Increased by 39%.
NOTE: Based on information from the Greater Baton Rouge Association of REALTORS®\MLS for the period of 01/01/2008 to 10/12/2011. This information was extracted on 10/12/2011.
