https://www.denhamspringsappraisers.com/ – Livingston Parish Homes Sales Report For March 2010. Below are compiled comparisons of Livingston Parish, MLS Areas 80, 81, 82 and 83, Detached Single Family Homes, based on March 2010, February 2010 and March 2009 numbers.
By Monthly Home Sales Comparison. March Monthly Sales were 87 home sales. For February 2010, there were only 77 sales, which represents a March increase of 13%. Comparison of March 2009 vs. March 2010? There were 90 sales in March 2009, which means a small decrease of 3%.
By Average Sales Price Comparison. Average Sold Price was $159,377. Comparison to February 2010: Decreased slightly 1% from $160,746. Comparison of March 2009 vs. March 2010: Decreased 5.76% from $169,115.
By Median Sales Price Comparison. (Which This Appraiser Believes Is A Much More Accurate Indicator). Median Sold Price was $150,000. February 2010 was also $150,000. Comparison of March 2009 vs. March 2010: Decreased 3.54% from $155,500.
Current Inventory or Number Of Homes On The Market. Current “Months Inventory” is 7.59 months. In February 2010 it was 8.35 months, which means we’re better in March 2010. In March 2009, there was a 6.24 months supply.
Average Time It Took To Sell A Home? In March 2010, it took 110 days. In February 2010 it took 106 days and in March 2009 it took 91 days.
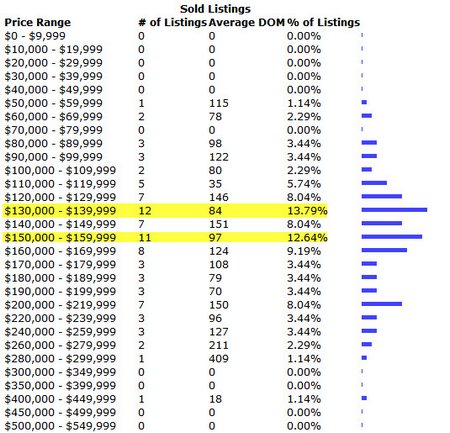
What Price Range Had The Most Home Sales? In March, the price range experiencing the most sales was the $130,000 to $139,999 range. Same for February 2010 as well. And, same for March 2009 as well.

NOTE: Based on Detached Single Family Solds in MLS Areas 80, 81, 82 & 83 information from the Greater Baton Rouge Association of REALTORS\MLS for the period 03/01/2010 through 03/31/2010. This information was extracted on 04/21/2010.

